This is part one of a three part series analyzing The Day of the Tentacle:
This post is an introduction to Puzzle Dependency Graphs.
The following is excerpted from a talk I gave at GDC 2016 on Puzzle Dependency Graphs. The full slides from that talk are available here. For a companion to this primer please see my analysis of the Day of the Tentacle which includes the full dependency graph for that game.
This is an introduction to an analytical technique which can be used to gain insights into the size, structure and complexity of a game. It helps visualize non-linear branching in the puzzle structure which can be key for tuning difficulty and pacing. It is of use in games with interrelated puzzles where solving one puzzle gets you something you need to solve other puzzles. Adventure games are a common example but many other genres and game types exhibit this design. I’ll discuss the theoretical background of the technique, what you can learn from using it and reference some free tools which can be used to make and analyze these graphs yourself.
The technique is called a Puzzle Dependency Graph.
History and References
Ron Gilbert is credited with the first use of dependency graphs for puzzles in game design. His blog post on the subject has a wealth of information (including the full graph from Deathspank). Another fantastic resource is a talk by Noah Falstein from GDC 2013: The Arcane Art of Puzzle Dependency Diagrams.
Both Ron and Noah are legendary LucasArts designers and have over thirty years’ experience using this technique in game design. Because their resources are available I will not attempt to repeat what they have already said and this post will focus on the theory behind the technique, practical advice on how to create the graphs and some additional thoughts of my own on new ways to analyze a graph once it has been created. Again, for a wealth of practical advice and time-tested experience, please review the links above.
Formal Definition
Puzzle Dependency Graphs are also referred to as a “chart” or “diagram” but I prefer the term “graph” because it is an application of a dependency graph which is a well-known data-structure with a formal definition. A dependency graph is itself a form of a directed acyclic graph which is a class of a general graph. To make sense of all this I’ll give a brief description of each.
Graph
At the most basic level a graph is a way to represent a collection of items and the relationships between them. Typically visualized as nodes connected by edges. Graphs can be ‘directed’ or ‘undirected’. A directed graph has arrows for edges which indicate that the relationship between the nodes is asymmetric.
Dependency Graph
A dependency graph is a graph in which the nodes represent things which are dependent on other things. Often this is a dependency over time and indicates that the later thing cannot occur until its dependencies are satisfied. An example of this is a college course curriculum. A prerequisite course which must be completed before another course is a dependency. That is to say that the later course is dependent on the earlier one. For a familiar example in gaming think of crafting in Minecraft. Creating a wooden axe requires wooden planks and sticks and those could be graphed as dependencies of the axe.
A dependency graph is a common class of graph known as a Directed Acyclic Graph or “DAG”. This type of graph has directed edges and no cycles. A cycle in a graph would let you to loop back to a starting node by following edges out of it. This is not allowed in a dependency graph because you would never be able to satisfy any of the dependencies in the cycle. In a game this would be the equivalent of having a key to unlock a box actually locked inside the box itself.
Puzzle Dependency Graph
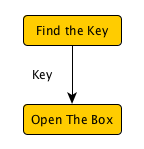
Simple Puzzle Dependency Graph
This, finally, is the application of a dependency graph to the domain of puzzles in a game. The nodes in the graph represent puzzles that the player can solve. The edges represent the dependencies between puzzles and can be labeled with the “thing” which is received from the first puzzle that is required to solve the second puzzle. For example if you did need a key to unlock a box there could be a “Find the Key” puzzle which would provide that key and allow the player to then complete the “Open the Box” puzzle.
Note that this definition does not actually specify what a puzzle is. A puzzle can in fact be anything you can possible program into a game. For the purposes of this discussion we will just say that a puzzle is anything a player can do in a game which produces or consumes dependencies. Likewise we won’t define what a dependency is. We will just pick a practical definition and say that a dependency is anything you need to solve a puzzle. Often this will be an inventory item (the key in the above example), access to a room or an area in the game world or certain behavior from other in-game characters. These are informal definitions (and self-referential!) but they codify the insight that as a player, solving puzzles gives you what you need to solve more puzzles.
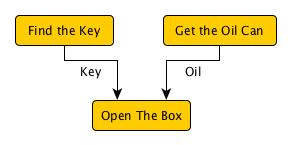
Multiple Dependencies
Puzzles can of course have more than one dependency. Say our locked box needs both a key and some oil to un-stick a rusty hinge before it will open. This situation is modeled by having two dependencies: “Find the Key” and “Get the Oil Can”. Both of those nodes have arrows pointing down to “Open the Box” which means they both must be completed before the box can be opened. Those two puzzles can be solved in any order as long as they are both solved prior to “Open the Box”. This situation where multiple puzzles are available for solving at the same time is known as Non-Linear Branching and will be discussed in depth below.
In Degree and Out Degree
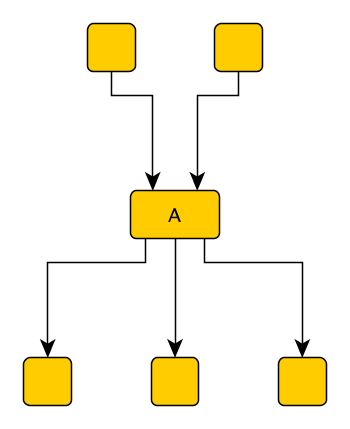
Node A has an In-Degree of 2 and an Out-Degree of 3
Two metrics which come up when analyzing a graph are in-degree and out-degree. These represent the count of upstream and downstream dependencies for a node. In-degree is the number of incoming edges (upstream dependencies) and out-degree is the number of out-going edges (downstream dependencies).
Puzzles with a higher out-degree than in-degree open up the branching and leave more puzzles available for solving. The reverse situation where a puzzle has a higher in-degree than out-degree means that solving the puzzle closes down the branching and consumes more dependencies than it creates. The size of the difference between the in and out degree can be indicative of the role a puzzle plays in the game. A puzzle with higher out-degree means the non-linear branching increases and the player has more options for downstream puzzles to solve. Often in this situation the narrative either branches along with the puzzle structure or there is no narrative connection between these downstream puzzles at all. When the branches are collapsing and coming together in a puzzle with a high in-degree this can indicate a narrative plot line is being resolved. For more on how non-linear branching affects narrative see below.
Graph Layout
To properly visualize the puzzle dependency graph I suggest you use a top-down hierarchical layout with puzzles grouped into horizontal layers as shown in the diagram below. Edges in this type of layout are only drawn going down, not up or horizontally. Nodes are then placed in the highest layer possible which does not violate that restriction. This means that all nodes will have at least one dependency in the previous layer or they are a root node (on the first layer). By using this type of layout we ensure that the shape of our graph is consistent and can be compared with graphs of other games. The layers also give an indication of the amount of non-linear branching which can occur at any point in the game.
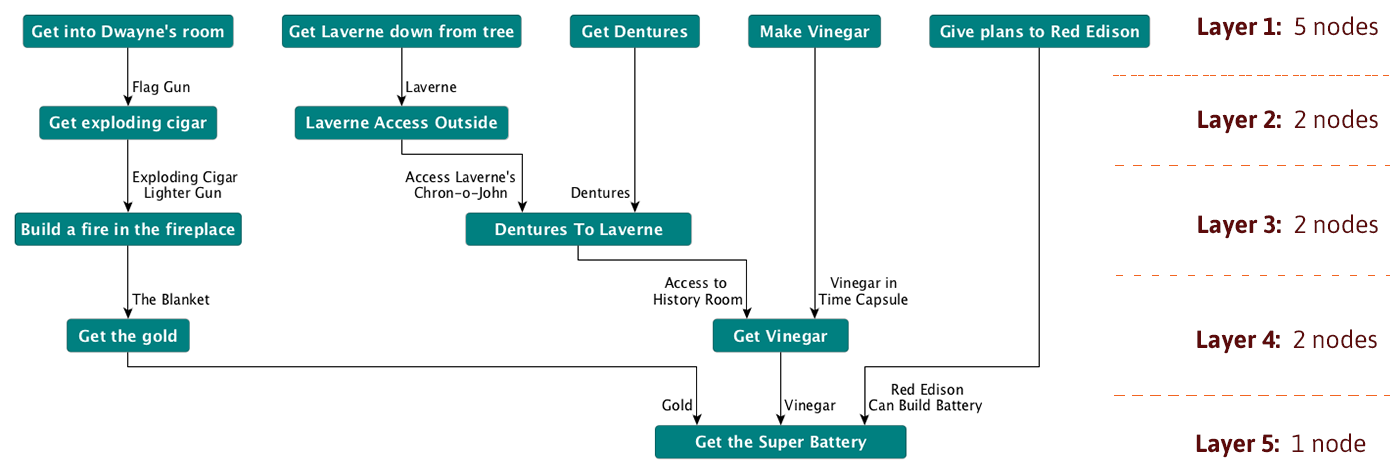
Five layers from The Day of the Tentacle
This type of layout can be automatically generated by some of the software packages referenced below.
Topological Orders
In most applications of a dependency graph it is desirable to find an order that the nodes could be visited such that the dependencies are satisfied by the time we get there. This would give us the order in which we could take courses in our courseware example. In the Puzzle Dependency Graph it will give us a valid order in which the player could solve the puzzles in the game. This order is known as a Topological Order and can be found by applying a Topological Sort algorithm.
Typically when designing a game “by hand” there is no need to actually implement or run a Topological Sort as it is clear from the graph if there is a way to win the game or not. If your game is programmatically generating puzzles and dependencies between them then you might want to generate a dependency graph in memory and run a topological sort on it. In any case the important thing to note is that there can be more than one valid topological order for a given graph. In fact there may be very many valid orders in which the player may solve the puzzles in a game.
Non-Linear Branching
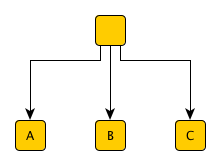
Three puzzles are available
Non-Linear Branching in a puzzle dependency graph is defined as a point in the game at which more than one puzzle is available to be solved. This means that multiple puzzles have their dependencies satisfied and the player is free to solve them in any order. The diagram here shows this situation where after solving an initial puzzle the player can then solve A, B or C in any order.
Note we are not talking about a branching narrative structure in which a player can experience one of many stories depending on their choices. What we are concerned with here is a branching puzzle framework in which multiple puzzles are available at a single time and the player can choose the order to solve them in.
Non-linear branching of this type can provide many benefits for a game. It gives the player multiple options for what puzzles to solve at a particular time and helps avoid the situation where the game grinds to a halt because the player is stuck on a single puzzle. On the downside, however, Non-Linear Branching can complicate narrative and plot development. The reason has to do with the number of orders the player may solve the puzzles in.
To make this more concrete: If a layer has three puzzles in it, that indicates that it is possible for all three puzzles to be “open” at the same time. If the puzzles are labeled ‘A’, ‘B’ and ‘C’ then it is possible for the player to solve them in any of the following orders:
| 1 | ABC |
| 2 | ACB |
| 3 | BAC |
| 4 | BCA |
| 5 | CAB |
| 6 | CBA |
So 6 orders are possible. This number can also be arrived at by taking the factorial of the number of puzzles in the layer (see Permutation). In this case 3 * 2 * 1 = 6. This number will grow very rapidly when adding more puzzles to the layer. With 4 puzzles the count is 24. With 5: 120. In the game The Day of the Tentacle there is a layer with 13 puzzles which results in over 6.2 billion possible orders.
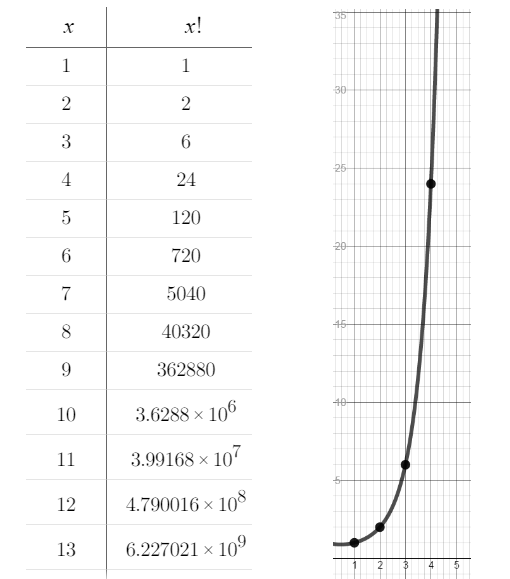
The number of permutations of a set grows very quickly as the number of elements in the set increases.
Non-Linear Branching and Narrative
So the player can solve puzzles in many different orders but what does this have to do with narrative? Good game design encourages you to tie puzzle completion into the narrative. This allows the player to move the plot forward with their actions. The complications arise when writing dialogue and descriptive text around puzzles in a non-linear segment which may occur in any order. You can’t make assumptions about what narrative information the player has since there are likely too many possibilities.
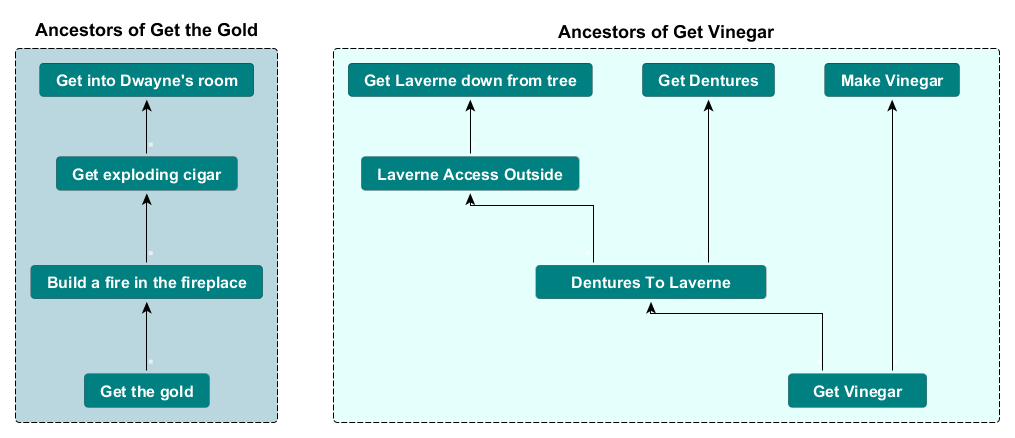
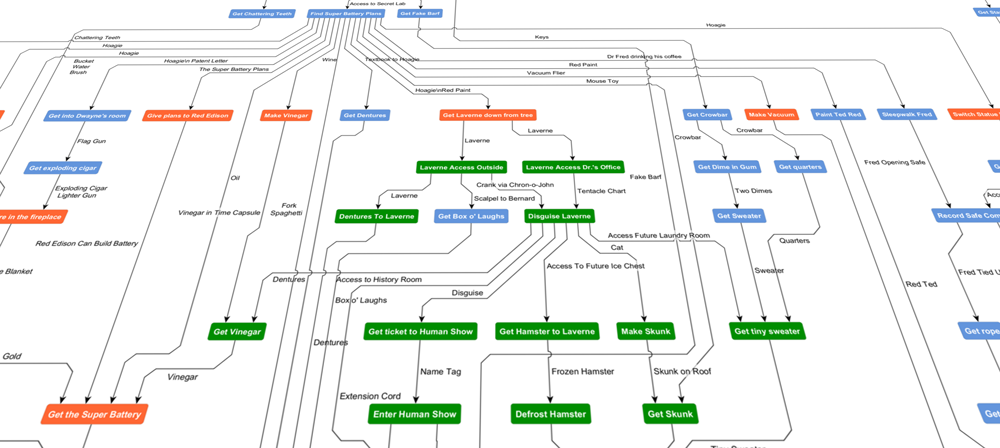
The ancestor graph can be found by reversing the dependency graph above a puzzle.
As an example, take the diagram above from The Day of the Tentacle. “Get Vinegar” and “Get the Gold” have disconnected graphs above them meaning that they have no ancestor nodes in common. When writing the narrative around “Get Vinegar” the designer must be careful not to reference any plot points or information which is revealed outside of that puzzle hierarchy. It might be tempting to mention giving the plans to Red Edison in the dialogue around the Vinegar puzzle but there is no guarantee that the player has done that yet. The only puzzles which definitely have been solved at this point are in the ancestor graph above “Get the Vinegar”. Therefore, when integrating puzzles and narrative, pay attention to the ancestors in the inverted dependency graph above the puzzle in question. The puzzles in that collection are guaranteed to have been solved and you can safely reference any narrative event which was revealed in them.
Tools
While it is possible to draw dependency graphs by hand or with general graphics software you will get many benefits from using a tool which understands something about the data structure you are creating. Graphing packages like Visio or Omnigraffle have the useful ability to maintain connections between nodes when moving them around and some edge routing capabilities but they are lacking in layout algorithms. I encourage you to explore the following packages which are better suited to creating and rendering Dependency Graphs:
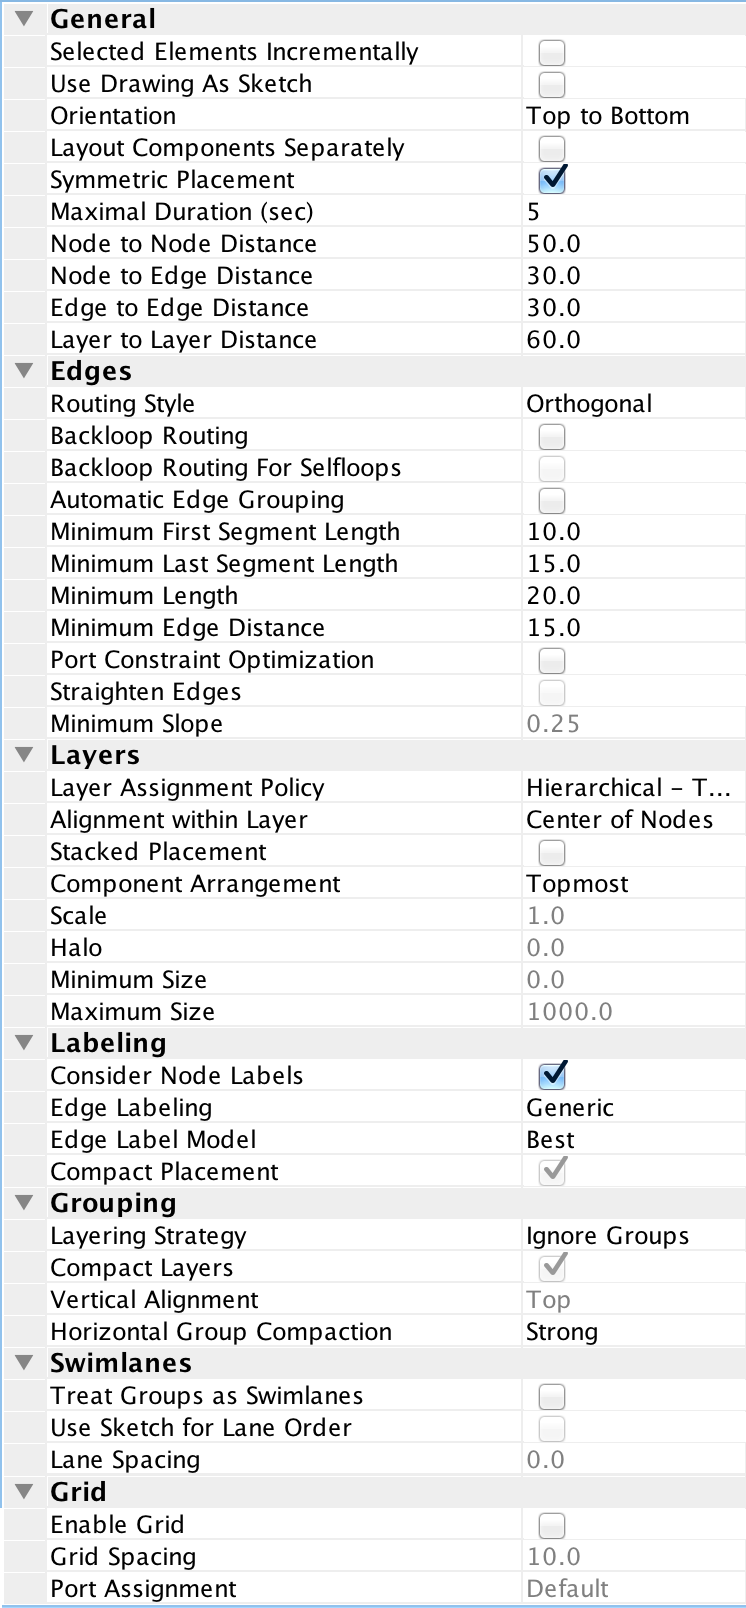
- yEd: Full featured graphing tool with useful layout and edge-routing algorithms with many options. Support for swim lanes and grouping. Highly recommended for this type of graph. I used yEd to generate the graphs in this blog and in my Day of the Tentacle analysis. Download yEd. The specific configuration settings I recommend for the layout in yEd.
- Tulip: Somewhat difficult user interface but has support for advanced features such as manipulating nodes programmatically via a built-in python interpreter. Includes the Sugiyama layout algorithm which is specifically designed for dependency graph data. Download Tulip.
- Graphviz/GVEdit: Basic graphing with programmatic support. Uses the DOT graph description file format which may be useful if converting graph data from other tools. Download Graphviz/GVEdit.
Business Process Analysis Tools
One final area which deserves mention is the potential for the use of Business Process Analysis software to analyze puzzle dependency graph data. This type of tool is typically used to optimize production processes in which multiple tasks may be undertaken in parallel. It can be adapted to our purposes by treating each puzzle as a task which must be completed in the process. One such tool is the Cambridge Advanced Modeler (CAM) which I used to create the diagrams in this section.

GANTT Chart for The Day of the Tentacle Puzzles
Two common types of diagrams which can be generated by this approach are the GANTT chart and the Dependency Structure Matrix (DSM). Both represent the same dependency information but provide different insights. The GANTT chart displays puzzles in rows with the layers as columns. The green boxes indicate when a puzzle has its dependencies satisfied. The number of green boxes in a vertical column are the number of puzzles which could potentially be performed simultaneously as they have no inter-dependencies. This count is the degree of non-linear branching and is the same as the number of puzzles in the corresponding layer in our dependency graph. The benefit of this chart is that it makes the shape of the graph very clear. In this example from The Day of the Tentacle we can see that the game starts off with a few linear puzzles which are used to set up the plot. By the fourth column we see the non-linear segment of the game open up dramatically where 13 puzzles are all available at once. Then as the player closes down the branches of the graph by solving puzzles we return to a more linear and narrative driven format to close out the game.
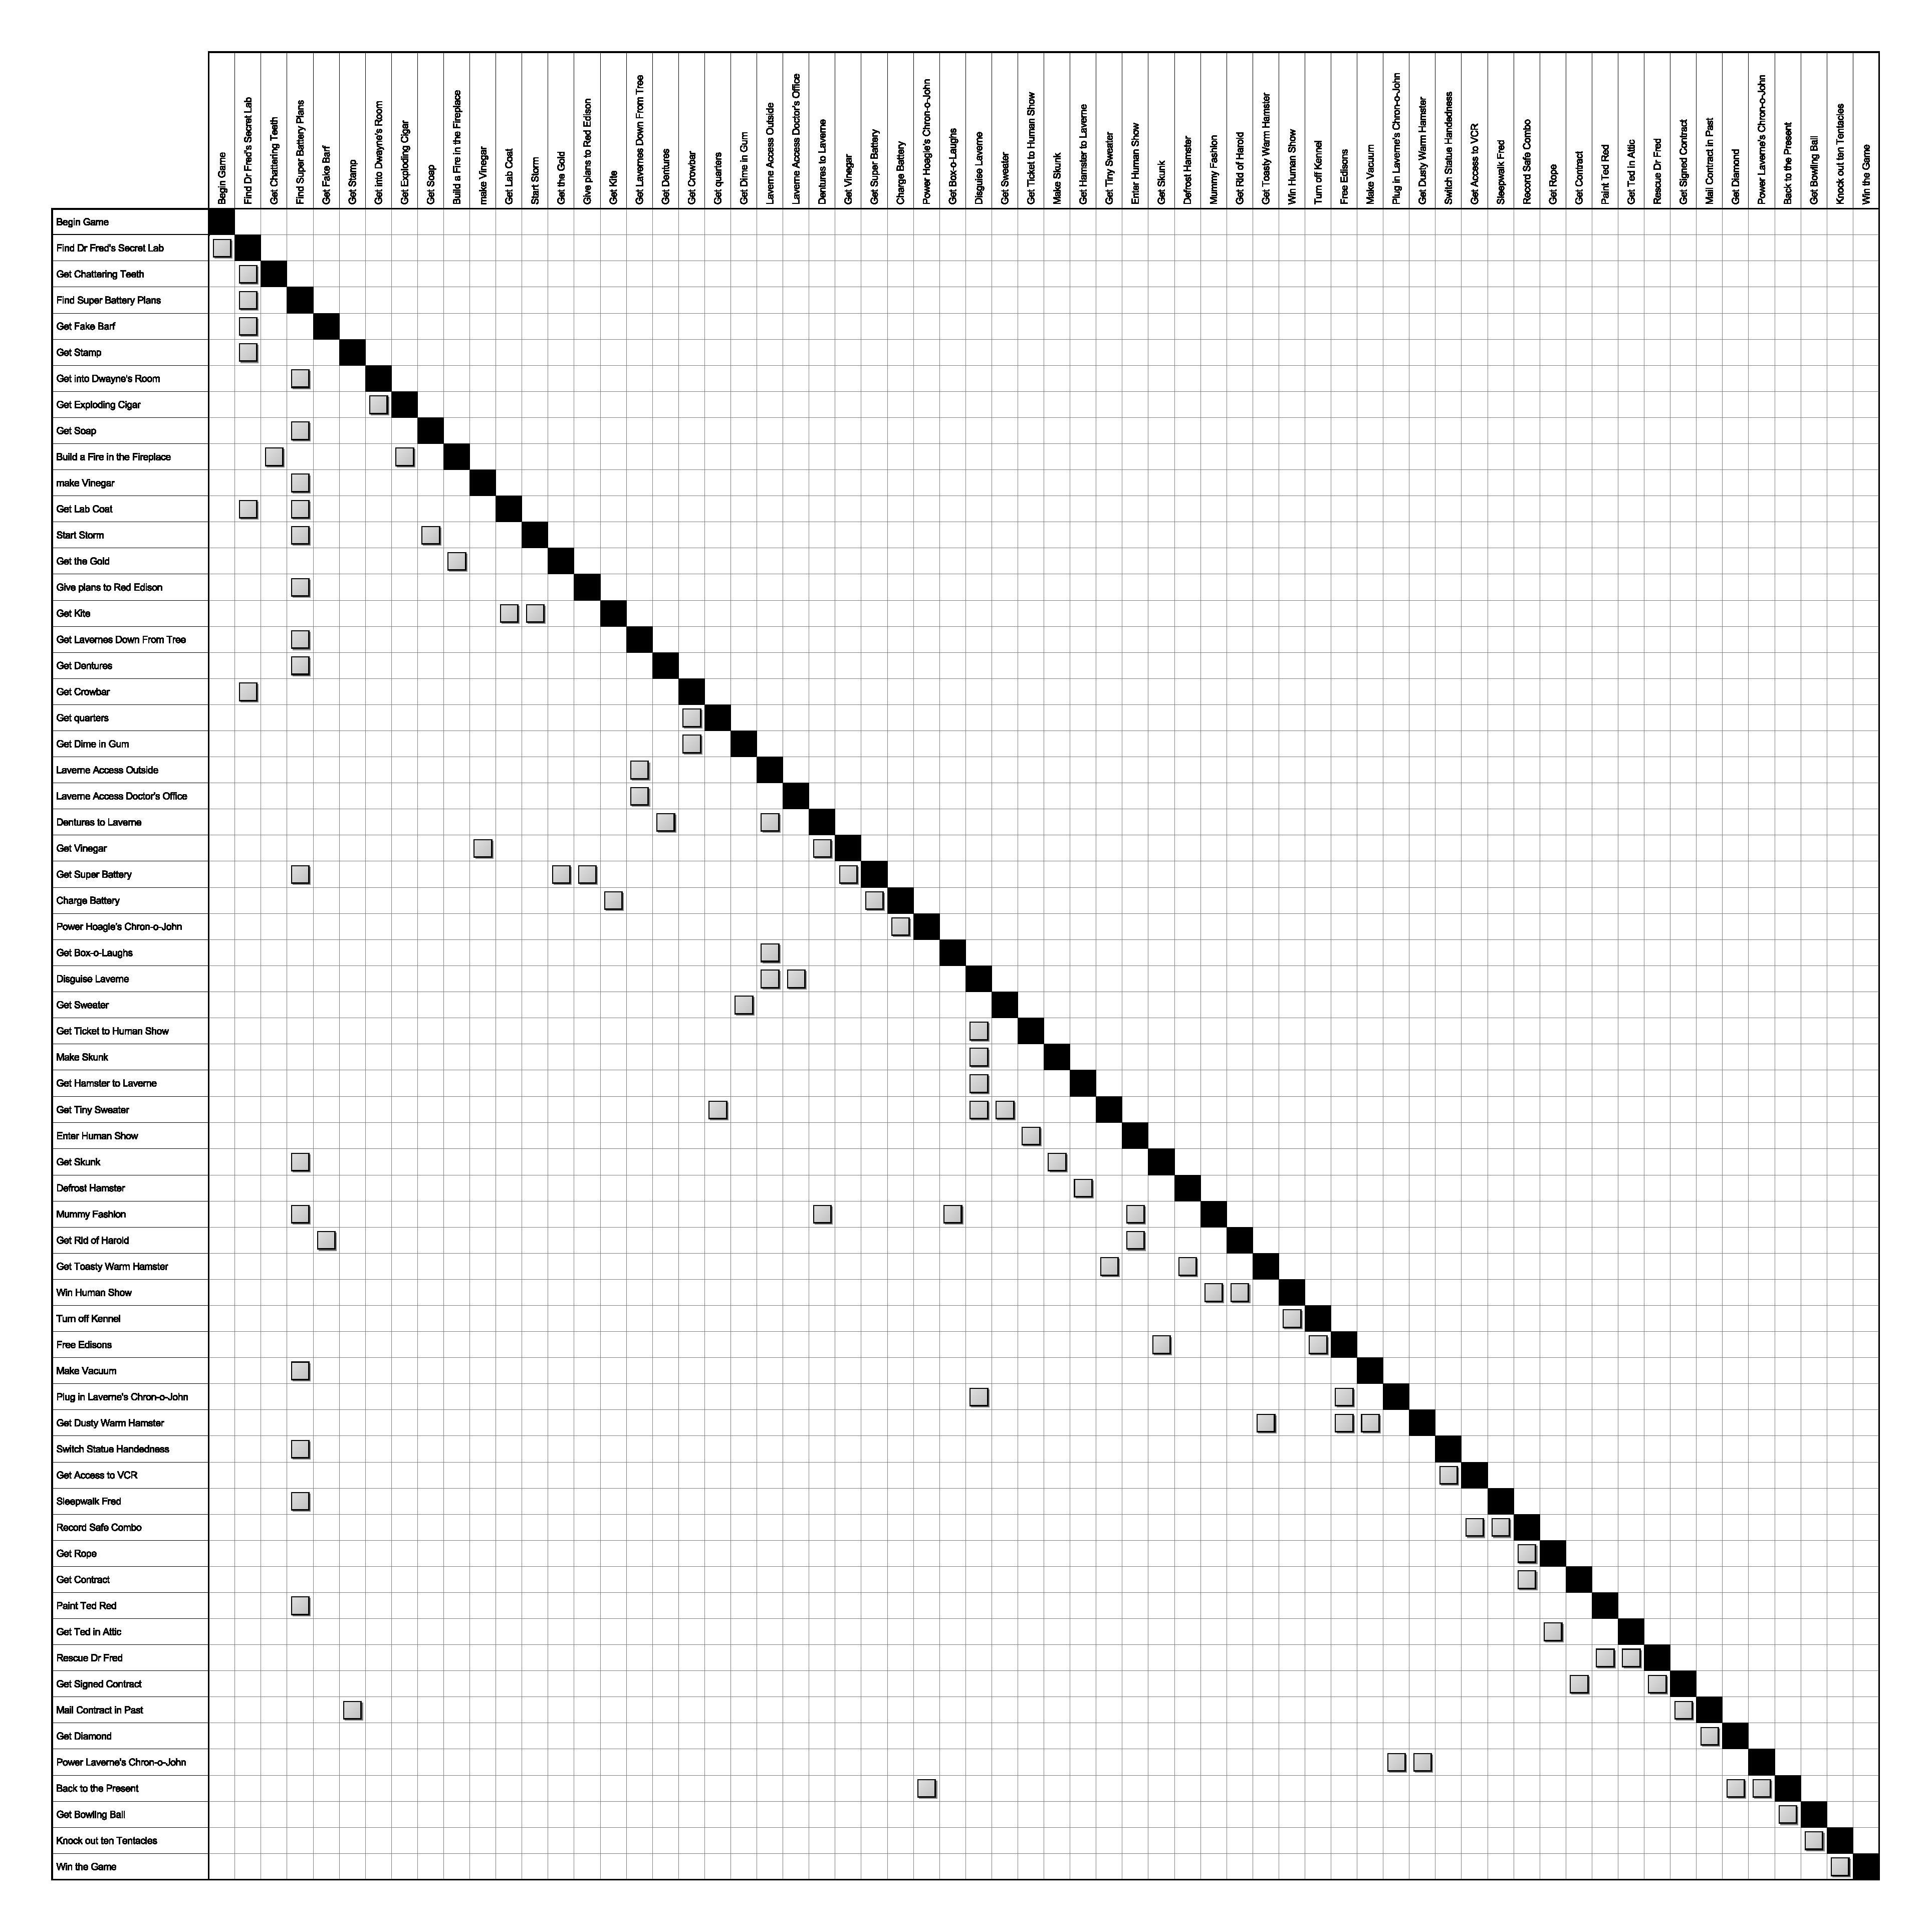
Dependency Structure Matrix for The Day of the Tentacle Puzzles
The DSM shows us a highly compacted version of the same information. Puzzles are listed on both rows and columns with marks in the grid to indicate dependencies between puzzles. Reading down a column reveals the children of a particular node, i.e. the downstream puzzles which are dependent on it. Reading across a row reveals the parents of a node, i.e. the upstream puzzles which it is dependent on.
The puzzles are ordered using a topological sort or other sequencing algorithm which leaves no marks above the diagonal (which would indicate either a dependency cycle or a puzzle being solved before one of its dependencies). By glancing at the DSM we can see the non-linear segments of the game as columns with many marks vertically and the linear segments of the game having single marks trending along the diagonal.
More Fun With Business Process Analysis
In closing I would like to suggest one more analytical approach which I have not explored extensively but which might lead to interesting results.
A tool like CAM will allow you to perform other types of analysis on your dependency graph. The software allows you to assign a time range to each node which is intended to model the time it would take an individual to complete a task in a production workflow which is then executed in parallel by multiple workers. This is not a good analog to a single-player game where the actions are taken serially by one player. However often the player does “work on” multiple puzzles simultaneously just by wandering around and trying different things with different inventory items. With that in mind we could potentially adapt the time-range to our purposes by treating it as a range of difficulty which we estimate (or observe) for each puzzle.
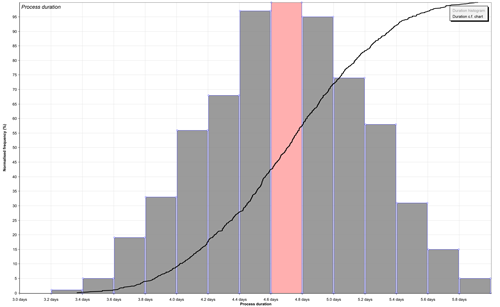
Histogram generated from 1000 random “play-throughs” of a simple puzzle dependency graph with estimated time assignments for each puzzle.
With a range assigned to each node in the graph, CAM is able to apply a statistical modeling algorithm using a Monte Carlo method to forecast the result of many thousands of play-throughs of the entire game. The result is a histogram and accumulated effort curve as seen in this diagram.
This analysis could give you an idea of the difficulty and estimated time to completion for the game in the current configuration. By manipulating the dependency graph or the time estimates on individual nodes and then re-running the simulation you could compare the histograms against each other to predict effects of making changes. This type of analysis is common when working to improve a manufacturing or business process and is potentially valuable in game design.
Closing
I hope this information has been enlightening. To review:
- Learn from the masters:
- Ron Gilbert: Puzzle Dependency Charts
- Noah Falstein: The Arcane Art of Puzzle Dependency Diagrams
- Puzzle Dependency Graphs are Dependency Graphs which are DAGs. Plenty of resources are available to learn about these data structures.
- Non-Linear Branching can be good for game design but can lead to a huge number of orders in which the player may solve the puzzles. This leads to complications when telling stories around the puzzles. So…
- Integrate puzzles with narrative by looking at the inverted dependency trees above a puzzle to see which events can safely be referenced.
- Use tools:
- yEd: Download here. (Configuration hints for Hierarchical Layout)
- Tulip: Download here.
- Graphviz/GVEdit: Download here
- CAM (Business Process Analysis): Download here
- Thank you. Stay in touch!
- @brickshot
- thewebsiteisdown.com